Introduction
In the frame of the GATEKEEPER project, MultiMed Engineers supported AReSS Puglia to assess the potential of the GATEKEEPER AI Framework in analysing real world datasets (RWD) available to AReSS, that include information on healthcare resource utilization and costs related to multimorbid chronic patients, enrollable in the regional Chronic Care Model (CCM). In particular, such datasets would allow to test the usage of the GATEKEEPER AI framework to develop better models for predicting health expenditure, based on various features related to patients and their care context. The real-world nature of the dataset would ensure that the derived models would represent a strategic element for supporting innovative, data-driven healthcare planning and policy making at AReSS, ultimately directed to healthcare resource optimization.
To proceed in this direction, an appropriate GATEKEEPER AI experiment has been designed and conducted by MultiMed Engineers along the following procedure:
- Support AReSS Puglia in the identification of a dataset of sufficient size and quality to (a) ensure meaningfulness of results and (b) adequately stress-test the GATEKEEPER Platform and AI framework
- Specification of a suitable research question to drive the AI experiment
- Conversion of the retrospective dataset into HL7 FHIR standard, aligned with the GATEKEEPER FHIR Implementation Guide, for storage into the GATEKEEPER Data Federation repository
- Creation of a Jupyter Notebook on top of the GATEKEEPER AI Framework’s Ezmeral environment, for conducting the AI experiment
- Reporting results of the AI experiment
The following sections illustrate each of the above elements in more detail.
The AReSS retrospective dataset
To achieve the above objectives, MultiMed Engineers and AReSS Puglia have identified the availability of a retrospective dataset including 3,210 multi-chronic patients collected by AReSS from relevant administrative and regional EHR repositories, subsequently anonymized and made publicly available to the research community, as described in the article https://doi.org/10.1186/s12913-018-3075-0.
The dataset includes 44 variables, the meaning of which is described for 32 of them in the mentioned article. Variables include information on demographics, health risk, healthcare provision, healthcare costs. The codebook of the dataset’s variables is reported in Annex 1 below.
The dataset includes 1,074 “case” subjects that were enrolled in the regional CCM after an individually specified index date, and 2,136 “control” subjects that received only standard of care. In the latter case, the index date is comprised in the same time period of the index dates for the former case.
Conversion in FHIR format according to the GATEKEEPER FHIR Implementation Guide
As a second step, the dataset has been converted into HL7 FHIR, in alignment with the GATEKEEPER FHIR Implementation guide.
The following FHIR resources have been created:
- A ResearchStudy resource, as an entry point for the dataset as a whole
- A ResearchSubject resource for each subject in the dataset, connecting it to a related Patient resource
- A Patient resource for each ResearchSubject, storing patient related information, including the identifier of the patient’s General Practitioner and a reference to the Distretto Socio Sanitario (local health and social district, see below) managing healthcare provision for her/him
- Two types of Organization resource, representing the following organizational units:
- Azienda Sanitaria Locale (ASL): the local health agency responsible for managing healthcare provision to citizens in the frame of the Italian regional health services. In Puglia they are further subdivided into Distretti Socio Sanitari (see below). The “type” element for this Organization has been coded as “asl”, according to an existing ValueSet established by HL7 Italia (https://build.fhir.org/ig/hl7-it/terminology//ValueSet-tipoOrganizzazione.html).
- The Distretto Socio Sanitario (local health and social district): in the context of the Puglia Region’s healthcare system, they are sub-units of the ASLs and they are the health management organization closest to citizens. The “type” element has been coded as “dist‑san”, according to the same ValueSet mentioned above. An Organization resource of this type also has a “partOf” element that refers to the Organization resource related to the ASL of which the Distretto Socio Sanitario is part.
- Several Observation resources (19 for each patient) to represent dataset variables other than those already stored in the ResearchSubject and Patient resources. They have the following codes:
- LOINC code 30525-0, for representing Age
- GATEKEEPER code “risk-score-ddci”, for representing the DDCI risk score (see https://doi.org/10.1371%2Fjournal.pone.0149203)
- GATEKEEPER code “risk-score-cci”, for representing the Charlson Comorbidity Index risk score
- GATEKEEPER code “healthcare-costs-drugs”, for representing the cost for drugs (two different Observation resources per patient, for variables F_SPESA_PRE and F_SPESA_POST respectively, related to the period before and after the index date)
- GATEKEEPER code “healthcare-costs-hospitalizations”, for representing the cost for hospitalization (two different Observation resources per patient, for variables H_SPTOT_PRE and H_SPTOT_POST respectively, related to the period before and after the index date)
- GATEKEEPER code “healthcare-costs-hospitalizations-unplanned”, for representing the cost for unplanned hospitalization (two different Observation resources per patient, for variables H_SPURG_PRE and H_SPURG_POST respectively, related to the period before and after the index date)
- GATEKEEPER code “healthcare-costs-outpatient-visits”, for representing the cost for outpatient visits (two different Observation resources per patient, for variables S_SPESA_PRE and S_SPESA_POST respectively, related to the period before and after the index date)
- GATEKEEPER code “hospitalizations-number”, for representing the number of hospitalizations (two different Observation resources per patient, for variables H_NTOT_PRE and H_NTOT_POST respectively, related to the period before and after the index date)
- GATEKEEPER code “hospitalizations-unplanned-number”, for representing the number of unplanned hospitalizations (two different Observation resources per patient, for variables H_NURG_PRE and H_NURG_POST respectively, related to the period before and after the index date)
- GATEKEEPER code “hospitalizations-length-of-stay”, for representing the number of days spent in hospitalizations (two different Observation resources per patient, for variables H_LOSTOT_PRE and H_LOSTOT_POST respectively, related to the period before and after the index date)
- GATEKEEPER code “hospitalizations-unplanned-length-of-stay”, for representing the number of days spent in unplanned hospitalizations (two different Observation resources per patient, for variables H_LOSURG_PRE and H_LOSURG_POST respectively, related to the period before and after the index date)
The 10 GATEKEEPER codes mentioned above had to be created anew in order to store quantities not covered by existing ValueSets, and they have been added to a specific Observation profile, in the GATEKEEPER FHIR Implementation Guide. The profile includes binding to the specific ValueSet that includes the above codes. The profile also includes the “workflow-researchStudy” extension.
Overall, the dataset is stored in the GATEKEEPER Data Federation repository as a collection of 67,430 FHIR resources, as summarized in the following table:
Table 1. Experiment FHIR resources
| Resource | Number |
| ResearchStudy | 1 |
| ResearchSubject | 3,210 |
| Patient | 3,210 |
| Organization | 19 |
| Observation | 60,990 |
| Total | 67,430 |
Formulation of the research question
In general terms, the described dataset makes it possible to train AI models that predict
- Expenditure (on planned/unplanned hospitalizations, drugs, specialist visits)
- Resource usage (planned/unplanned hospitalizations number and length of stay)
Based on
- Demographics (age, gender)
- Participation in the regional CCM program
- Risk (DDCI, CCI)
- Municipality of residence
- Healthcare received
- GP (anonymous id)
- Regional care organizational units (ASL, Distretto Socio Sanitario)
In particular, in the frame of the GATEKEEPER project’s Puglia Pilot, it would be of interest to understand if deep learning (DL) methods would allow to better address such types of prediction problems, with respect to non-DL Machine Learning (ML) schemes. In fact, such models could be better suited for capturing the influence of heterogeneous sets of variables, including features related to healthcare services provision, which might play an important role for supporting health decision makers in planning ahead, identifying best practices and improving health resource management.
To maximize data usage, the following specific research question has been formulated by referring to prediction in a standard-of-care scenario, so that both “case” subjects (selecting observations before the index date only) and “control” subjects (selecting all observations, both before and after the index date) could be used in training, validation, and testing:
Could DL models improve the prediction of healthcare costs in the standard-of-care scenario, based on multiple characteristics of subjects – including demographics, risk scores, and healthcare provision services – using real world datasets available at AReSS, as the above described one?
Experiment conduction
To address the established research question, a Jupyter Notebook has been created on top of the GATEKEEPER AI framework’s Ezmeral environment, as shown in the following picture, for conducting the AI experiment.
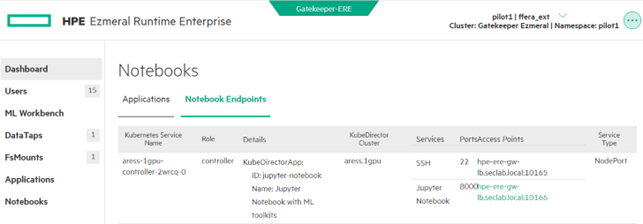
Figure 1. GATEKEEPER Ezmeral platform screenshot
The AI experiment has been articulated along the following actions:
- Extract the dataset from the FHIR resources stored in the GATEKEEPER Data Federation repository
- Preprocess the data to make it suitable for the problem at hand. In particular, the following input and output variables have been computed, based on the dataset
- Input variables: age, gender, general practitioner, municipality (which determines the local health district and local health agency), DDCI risk score, CCI risk score
- Output variable: total healthcare expenditure per year, for drugs, hospitalizations, and specialist visits
- Training and testing a relevant DL model for predicting healthcare costs, based on patient features
- Training and testing conventional ML models (conventional linear regression, Ridge corrected linear regression, XGBRegressor) for comparison purposes
- Comparing the performance measures of the DL model with respect to conventional ML models, and conclude about the value of AI models, developed, and deployed on the GATEKEEPER AI framework
Tensorflow and Keras were used to create the DL model, scikit-learn was used to create linear regression models and XGBoost was used to create the XGBRegressor model.
The full Jupyter Notebook is reported in Annex 2, including outputs. In the following, its main sections are illustrated in detail.
- Data preparation
- Reading data from GATEKEEPER Data Federation: data are read through the FHIR API, in pages of 200 subjects each; only 15 variables, useful to address the research question, are extracted (CASECTRL, SESSO, COMURESI, MEDICO, AGE, F_DDCI_PRE, H_CHARL_PRE, F_SPESA_PRE, INDXDATA, F_SPESA_POST, LASTDATA, H_SPTOT_PRE, H_SPTOT_POST, S_SPESA_PRE, S_SPESA_POST – note: variables related to Organization resources, ASL and DISTRETTO, are not extracted as they are univocally linked to the municipality of residence variable, COMURESI); type conversion is performed for categorical and date variables
- Cleaning and transforming data: 9 subjects with missing MEDICO variable are removed; INDXDATA and LASTDATA are used to compute costs per unit of time; for “case” subjects, only the costs related to the period before the index date (i.e. related to standard-of-care, before the enrollment in the regional CCM) are considered; a total cost per year is computed for each subject, as the model outcome variable; all variables used to only support intermediate computations are dropped, leaving in the dataset a total of 6 input features plus the output outcome (respectively, SESSO of type category, COMURESI of type category, MEDICO of type category, AGE of type float64, F_DDCI_PRE of type int64, H_CHARL_PRE of type int64, SPESA_TOT of type float64); histograms of int and float variables are visualized, as a further check; finally, variables are stored in tensor form, including one-hot encoding of categorical ones.
- Building and training the DNN model: a Deep Neural Network (DNN) model is built, stacking together two dense layer and a final dense layer with a single unit and no activation function (linear layer), as it is usual for this type of regression problems; the RMSprop optimizer and the mean squared error (MSE) loss function are used; the DNN is trained by applying repeated 10-fold cross-validation; training and validation loss are logged for visualization during training (see Figure 1 below for an example run); the final selected model is the one trained on the whole training dataset, including the validation dataset, for the number of epochs that minimizes validation loss.
- Execute comparison: the above described DNN, a linear regression model, a Ridge corrected linear regression model and an XGBRegressor model are repeatedly trained on the train dataset and the resulting MSE losses, calculated on the testing dataset, are logged for comparison; during training, performance and progression information is visualized for further check.
- Output comparison results: finally the MSE loss values of the DNN model during the repeated runs are compared to, respectively, the MSE losses of linear regression, Ridge corrected linear regression and XGBRegressor models, reporting their differences, 95% confidence intervals (CI) and p-values; the last two parameters have been also reported with application of the Nadeau-Bengio correction to compensate for repeated assessment on the same dataset. The table below summarizes these results.
Table 2. Experiment results
| Model to be compared to DNN | MSE difference
mean (std) |
CI (95%) | p-value | Nadeau-Bengio corrected CI (95%) | Nadeau-Bengio corrected p‑value |
| Conventional linear regression | 1.07e+13
(4,82e+12) |
(6.40e+11, 2.08e+13) | 0.038 | (-2.32e+13, 4.46e+13) | 0.516 |
| Ridge corrected linear regression | 9.32e+5
(9.72e+4) |
(7.28e+5, 1.13e+6) | 1.05e-8 | (2.47e+5, 1.62e+6) | 0.010 |
| XGBRegressor | 1.67e+6
(1.99e+5) |
(1.25e+6, 2.08e+6) | 8.59e-8 | (2.65e+5, 3.07e+6) | 0.022 |
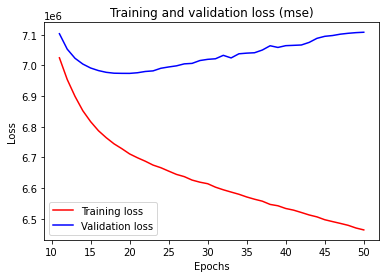
Figure 1. Example of one run excerpted from the DNN training procedure
Conclusions
The results of the above reported experiment confirm a positive answer for the posed research question, showing that a DNN with two fully connected 64 dense layers produce a significantly better MSE than ridge corrected linear regression and XGBRegressor (Nadeau-Bengio corrected p-value < 0.05). Although the DNN is also better than conventional linear regression in terms of MSE loss, the difference is not significant due to the very high variability of the linear regression’s MSE.
In conclusion, the AI experiment illustrated in this article:
- Confirms that datasets for training, validating, and testing predictive AI model can effectively be converted into a collection of FHIR resources, aligned with the GATEKEEPER FHIR Implementation Guide, and stored in the GATEKEEPER Data Federation repository
- Confirms that datasets stored in FHIR resources within the GATEKEEPER Data Federation repository can be extracted, pre-processed and used for model training, validation, and testing with the GATEKEEPER AI framework, running a Jupyter Notebook on the AI framework’s Ezmeral platform
- That Deep Learning models, developed on the basis of existing, real world dataset, available at AReSS Puglia, and using the GATEKEEPER platform as above described, can lead to performance improvements with respect to conventional ML models, such as Ridge corrected linear regression, and also with respect to more advances schemes, like XGBRegressor
 This work has been conducted as part of the GATEKEEPER project. The GATEKEEPER project has received funding from the European Union’s Horizon 2020 research and innovation programme under grant agreement No 857223