With the support of Fondazione Politecnico di Milano and AReSS Puglia, MultiMed Engineers conducted a series of analyses aimed at assessing the results of an e‑coaching program for active and healthy ageing directed to senior citizens in the Puglia Region and conducted in the frame of the GATEKEEPER Project.
Description of the intervention
The GATEKEEPER Puglia Pilot — which has been operationally coordinated by MultiMed Engineers — conducted, among others, a prospective, pre-post, case-control experiment to assess the viability of an e‑coaching service, focussed on encouraging healthy lifestyles, active ageing, and awareness of health risks.
Each participant received a stream of messages, accompanying health promotion resources. A resource could be a web page, a PDF file, a video clip, an image, etc. concerning general or specific information, opportunities or tips, about different subjects: active ageing in general, physical fitness, healthy nutrition, sleep hygiene, socialization. Accompanying messages played a crucial role in attracting the attention towards resources and motivating participants to consider them. Indeed, the very rationale underpinning the Puglia Pilot e‑coaching service is that while there is plenty of existing health promotion and active ageing resources, and more are constantly being produced, a missing step is ensuring that such resources are effectively consumed and put to use.
An e‑coaching planning system deployed by Fondazione Politecnico di Milano enabled an e‑coaching editor to concoct messages, connect them to resources (several messages per resource) and formulate appropriate delivery schedules, customized for subgroups of participants, in order to ultimately manage complex e‑coaching strategies, addressing various health promotion objectives in different ways. After an initial tuning phase based on SMS, the medium of delivery has been subsequently either notification via a specific GATEKEEPER Mobile App or email.
The targeted population has been 55+ years old, healthy individuals, living in the Puglia Region and willing to maintain their wellness trough advancing age. 17 local community stakeholders have collaborated in the recruitment process, including local healthcare agencies, senior associations, pensioner unions, and – notably – pharmacies.
Analysis of results
After the end of the e-coaching experiment, the following analyses have been conducted:
- Analysis of the e‑coaching system’s log data, to derive recruitment trends and associate them to enacted recruitment actions, in order to learn lessons that would allow to achieve higher enrolment rates in the future
- Analysis of an ad-hoc user satisfaction questionnaire, administered to participants at the end of the experiment, to assess their impressions with value and usability of the proposed e‑coaching service
- Analysis of EQ-5D-5L, PHE-S and HLS-EU-Q16 KPIs, along both a before-after and a case-control approach.
- Based on the analysis of the EQ-5D-5L KPI, conduction of a cost-effectiveness study to compute the intervention’s Incremental Cost Effectiveness Ratio (ICER) with the MAFEIP Tool, for various hypothetical registration fees, aimed at supporting the sustainable provision of the e‑coaching service.
These analyses are summarized in the respective subsections below.
Analysis of recruitment trends
Recruitment trends for the e‑coaching program are reported in the following chart.
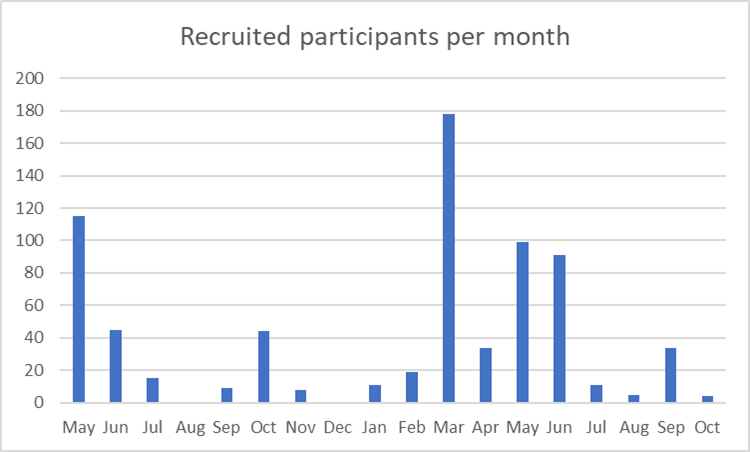
Figure 1. Recruited participants per month
The chart represents the number of participants recruited per month, from the start of the experiment (May 2022) to its end (October 2023). After an initial, exponentially decreasing trend in the months from May to July 2022 – due to the “en-masse” enrolment of citizens contacted in the preparation phase, before the registration opening date, and waiting for such date – the trend stabilized on a lower level, that revealed to be insufficient to achieve the numbers established in the experiment protocol (several hundreds of recruits per month). In October, a surge is likely due to the immediate, tactical actions that were put in place in September 2022, after discussion in Lecce Plenary Meeting (end of June 2022), where the issue was raised, jointly with other GATEKEEPER Pilots. However, the actual effects of the more strategic actions decided after that meeting – most of which dependent on first obtaining the Ethics Approval for a geographical extension of the experiment to the whole regional territory (the protocol initially covered the Provinces of Lecce, Barletta-Andria-Trani and Taranto) – started to appear in March 2023, as clearly visible in the chart. The months from March to July 2023, before the summer break, showed a relatively high and sustained recruitment rate, close to what was expected to achieve protocol’s objectives (see below).
In particular, analysis shows that this surge is mostly due to a two-pronged approach experimented in the Province of Brindisi – with related work starting in January 2023, when Ethics Approval from the Local Health Agency (ASL) of Brindisi was obtained, and on-field operations starting in March 2023 and ending in mid-July 2023 – which leveraged:
- A more systematic cooperation with the Local ASL and local community supporters, with continuous and periodic contacts – including face-to-face ones – with their representatives
- A formal agreement with the Association of Pharmacies in the Province of Brindisi, where Pharmacies themselves not only contributed to produce new health promotion resources to be vehiculated in the e‑coaching service, but also directly engaged in recruiting their customers, allowing the enactment of a “recruit the recruiters” pyramidal model
The effect of these actions is proved by the following two charts that show, respectively, (a) how the “Pharmacies” channel dominates among the targeted recruitment sources, and (b) how the Province of Brindisi dominates the geographical distribution of participants.
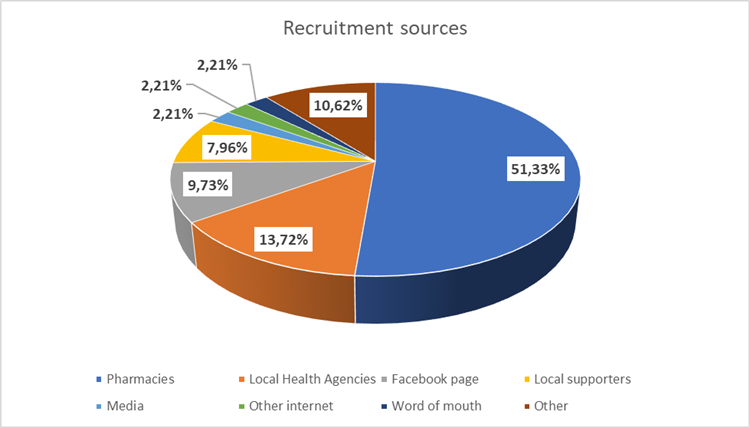
Figure 2. Recruitment sources
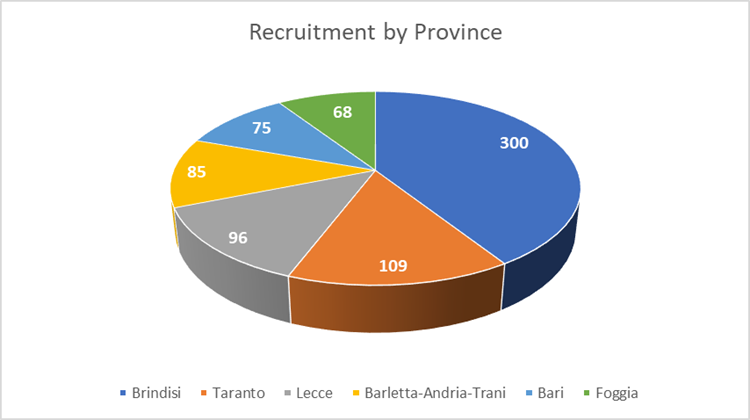
Figure 3. Recruitment per province
A simple projection quantitatively supports the hypothesis that future replication of this approach on all Provinces in the Puglia Region would allow to achieve the recruitment numbers envisioned in the protocol.
In fact, we can consider that, population-wise, the Brindisi Province has a size that is less than 10% of the population of the whole Puglia Region (see table below, data from ISTAT, 1/1/2023).
Table 1. Puglia population per Province
| Province | Population | Relative size |
| Bari | 1,223,102 | 31,35% |
| Barletta-Andria-Trani | 378,768 | 9,71% |
| Brindisi | 378,898 | 9,71% |
| Foggia | 594,007 | 15,23% |
| Lecce | 770,078 | 19,74% |
| Taranto | 555,999 | 14,25% |
| Total | 3,900,852 |
If the Brindisi approach – accruing in such Province 280 recruits in 4.5 months (from March 2023 to mid-July 2023, as previously mentioned), i.e. 62 recruits/months – would have been applied to all Puglia Region’s Provinces, it would have proportionally increased the recruitment rate to 640 recruits/month, allowing to effectively achieve the numbers envisioned in the protocol.
Analysis of a satisfaction questionnaire
The following chart reports the results of the satisfaction questionnaire administered to participants at the end of the experiment, where scores are based on 5-levels Likert scales (scoring 1 to 5).
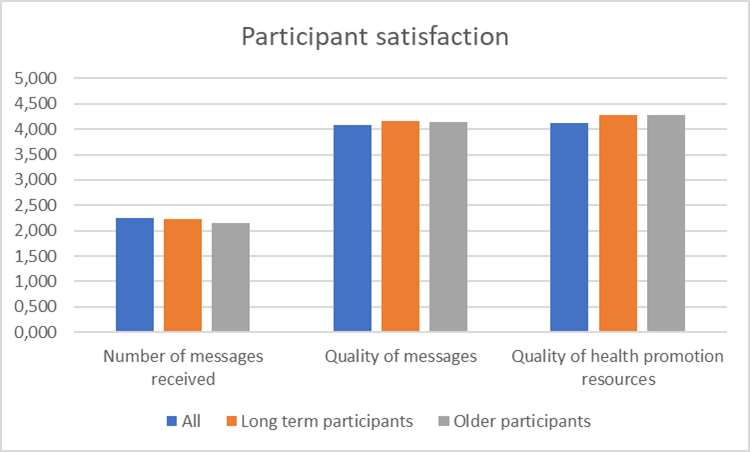
Figure 4. Participant satisfaction
It can be appreciated that, from the point of view of the participants, the experiment has been a resounding success in terms of both quality of health promotion resources delivered as well as the e‑coaching messages that accompanied such resources. Older participants and long-term participants where the most enthusiastic in this respect, confirming the acceptability of the service for supporting active and healthy aging along continued periods of time.
Participants were more critical with respect to the number of messages received (around 2-3 per day), as several of them considered those as too many. In this case, elder and long-term participants where the most concerned, probably reflecting a keen interest in optimizing what they believe to be a good service in the first place.
The following table reports the most relevant comments provided by participants in two qualitative, open-ended questions included in the questionnaire to collect their opinion on what they liked (38 comments) and what they did not like (27 comments) about the e‑coaching service. This confirms the success of the experiment, while pointing to better personalization as a future improvement.
Table 2. Comments received by participants
| What did you like most? | What didn’t you like? |
| GENERAL REMARKS
1. Everything did work well 2. Everything was interesting ABOUT CONTENT 3. Strong scientific basis 4. Receiving tips from very competent people ABOUT THE APPROACH 5. The friendly approach 6. Friendly and easygoing approach 7. Clarity of messages 8. Relaxed way of approaching health issues ABOUT THE NUMBER OF MESSAGES 9. Being followed every day 10. Receiving daily tips ABOUT SPECIFIC TOPICS 11. The overall culture of prevention 12. Recommendation about physical fitness 13. Tips about sight and glaucoma 14. Tips about hypertension and sight problems 15. Tips about sights and water consumption, in relation to kidney problems 16. Tips about diet and food 17. Focus on active ageing and prevention of major diseases 18. Tips about prevention and about staying in good physical shape |
GENERAL REMARKS
1. Nothing: I did like everything [11 comments] 2. I did not like anything [1 comment] 3. The app for reading messages sometimes freezes ABOUT CONTENT 4. Messages are not sufficiently personalized 5. I’m a male, but I received messages about menopause ABOUT THE APPROACH 6. I was expecting something different: a specific course about prevention ABOUT THE NUMBER OF MESSAGES 7. I was overwhelmed by the number of messages 8. A bit too many messages ABOUT SPECIFIC TOPICS 9. Did not like recipes 10. Did not like keeping the nutrition diary
|
In a third open-ended question which asked participants to formulate proposals for further improvement (26 comments received), many comments reflected the corresponding “What didn’t you like?” ones, but it is worth noting that 4 participants requested the possibility of adding two-ways interaction to the service, which points in the direction of studying the applicability of Large Language Models, such as GPT, in the future.
Analysis of EQ-5D-5L, PHE-S and HLS-EU-Q16 questionnaires
According to the intervention protocol, EQ-5D-5L, PHE-S and HLS-EU-Q16 questionnaires, measuring respectively perception of QoL, health engagement and health literacy, were administered before and after the execution of the e‑coaching service experiment.
The analysis has been conducted as follows:
- From the 732 participants to the experiment, a subgroup of 434 was selected, for which involvement in the experiment lasted at least 3 months with end by July 2023, and with final KPI data collected at the beginning of September 2023 (August was skipped to avoid low response rate due to the vacation period) leaving enough time for conducting the present analyses in the final months of the project. One user dropped out after the end of the experiment and just before filling in the final questionnaire, bringing the size of the subgroup to 433.
- Questionnaire responses were exported from the LimeSurvey platform, on which they have been collected,
- Using log data from the GATEKEEPER Mobile App management dashboard, participants who never logged in the GATEKEEPER Mobile App (likely due to the complexity of the installation process, as inferred from help desk interactions with participants) were considered as “controls”. Participants who logged in at least once in the GATEKEEPER Mobile App were considered as “cases”. Participants that selected to receive the e‑coaching program by e‑mail (instead of through the GATEKEEPER Mobile App) were all considered as “cases”, hypothesizing that those of them who decided to stop following the program sen un-subscription requests, to stop the email flow in their inboxes, and were consequently removed from the experiment.
- Data where further cleaned by removing
- One participant that registered twice, with two different emails
- Participants that dropped out between filling the start and end questionnaires (n=2, n=2, n=5 for EQ-5D-5L, PHE-S and HLS-EU-Q16 respectively), so that no pseudonym was available to connect responses and log data together, as needed to conduct the analysis
- (For the before-after analyses) participants that filled in the end questionnaire but not the start one (likely due to the invitation to fill the start questionnaire being trapped by spam filters; n=16, n=26, n=13 for EQ-5D-5L, PHE-S and HLS-EU-Q16 respectively)
- For each response to each KPI questionnaire, a score in the range [0, 1] was computed in the following way:
- For EQ-5D-5L, by applying the value set for Italy proposed by Finch et al (https://doi.org/10.1016/j.socscimed.2021.114519)
- For PHE-S, by converting each of the five, 7-levels Likert scale items to an integer in the range [0, 6], summing up items’ scores and computing the proportion with respect to the maximum possible value of 30.
- For HLS-EU-Q16, by converting each of the sixteen, 4-levels Likert scale items to an integer in the range [0, 3], summing up items’ scores and computing the proportion with respect to the maximum possible value, which, given that this KPI allows a “don’t know” response that was treated as missing data, depends on the number of missing items (in particular, 3 multiplied by number of non-missing items).
Given the resulting dataset, the following analyses have been conducted:
- Case-control analysis, based on KPIs collected at the end of the e‑coaching experiment for, respectively, “case” and “control” participants
- Before-after analysis, based on “case” participants, with KPIs collected, respectively, at the start and at the end of the e‑coaching experiment
Results of the analyses are reported in the following table (*** = significant with p < .05; ** = significant with p < 0.1; * = significant with p < 0.15):
Table 3. Outcome of EQ-5D-5L, PHE-S and HLS-EU-Q16 questionnaires analysis
| KPI | Case-control analysis
(at end of experiment) |
Before-After analysis
(for “case” participants) |
| EQ-5D-5L
(QoL) |
Control arm: 0.899 (n=66)
Case arm: 0.944 (n=50) p-value: 0.014 *** |
Before arm: 0.917 (n=45)
After arm: 0.944 (n=45) p-value: .115 * |
| PHE-S
(health engagement) |
Control arm: 0.597 (n=62)
Case arm: 0.682 (n=46) p-value: 0.06 ** |
Before arm: 0.664 (n=40)
After arm: 0.688 (n=40) p-value: 0.445 |
| HLS-EU-Q16
(health literacy) |
Control arm: 0.614 (n=68)
Case arm: 0.679 (n=51) p-value: 0.016 *** |
Before arm: 0.682 (n=48)
After arm: 0.687 (n=48) p-value: 0.824 |
The table allows to derive the following results:
- Only EQ-5D-5L has a (slight) statistical significance in the before-after analysis, which is corroborated by the case-control analysis. This is pointing in the direction of a very interesting impact of the GATEKEEPER supported e‑coaching program on the QoL perception parameter, that has been further analysed in a MAFEIP cost-effectiveness study, as reported below
- PHE-S and HLS-EU-Q16 have statistical significance (a strong one, in the health literacy case) only in the case-control analysis, but not in the before-after one (although the direction of the difference is slightly positive in both cases). Since the case-control analysis is not randomized, this points to the likely conclusion that participants who already have high health literacy and health engagement are more likely to accept and adhere to the e‑coaching program, while no firm conclusion on the impact of the program on these KPIs can be derived.
MAFEIP cost-effectiveness analysis
Given the demonstrated potential of the e‑coaching experiment to raise the QoL perception in participants, as measured by the standard EQ-5D-5L scale and as reported in the previous subsection, a relevant cost-effectiveness analysis has been conducted with the MAFEIP Tool, which is the HTA tool promoted by the GATEKEEPER project.
In particular, the assessment addressed how charging an annual registration fee per participant, for delivering the e‑coaching program in an economically sustainable way, would impact the Incremental Cost-Effectiveness Ratio (ICER) of the intervention, measured in €/QALY.
To propose a reasonable amount for the registration fee, we start from the exploitation plan developed by the City4Age project, in which the prototype version of the e‑coaching program has been conceived, developed and validated in the Province of Lecce, in 2018. Such plan proposed a 59€ annual fee (at end of 2018 prices), to ensure sustainability. At current prices (adjusted according to inflation data from the Italian National Statistics Institute, ISTAT, https://rivaluta.istat.it/) this corresponds to a 68.85€/year fee, which we used in the MAFEIP analysis. It is worth noting that this is a highly affordable amount, that corresponds to less than 6 €/month per participant.
A two-state Markov model has then been run to assess how the continued usage in time of the e‑coaching program would accrue (a) increments in QALY of participants vs non-participants, on one side, and (b) cost of the annual registration fee charged for participants, on the other side. The corresponding MAFEIP model input parameters are summarized in the following table.
Table 4. Input to MAFEIP model
| Parameter | Value | Notes |
| Discount factor for costs | 3.5% | As usual for this type of analysis and as per MAFEIP default suggestion |
| Discount factor for utilities | 3.5% | As usual for this type of analysis and as per MAFEIP default suggestion |
| Time horizon for analysis | 125 | To allow for absorption state transitions to occur |
| Minimum age | 55 | As per (protocol determined) participant population |
| Maximum age | 95 | Maximum allowed by MAFEIP, consistent with participant population |
| Gender | Both males and females | As per (protocol determined) participant population |
| Country | Italy | As per (protocol determined) participant population |
| Currency | EUR | Consistently with Country selection |
| Relative risk of mortality | 1 for everyone | Hypothesis: the e‑coaching program does not change mortality |
| Recurrent costs per person per year | 68.85 € for cases
0 for controls |
Fee charged for sustainably delivering the e‑coaching service |
| Healthcare costs | 0 for everyone | Hypothesis: the e‑coaching program does not change health expenditure |
| Societal costs | 0 for everyone | Hypothesis: the e‑coaching program does not change societal expenditure |
| Utility | 0.944 for cases
0.917 for controls |
As derived from the before-after analysis of the GATEKEEPER e‑coaching experiment (see previous table) |
Running the MAFEIP model, we obtain the results illustrated in the table below.
Table 5. Output from MAFEIP model
| Incremental cost | 863.82 € |
| Incremental effects | 0.339 QALY |
| Incremental cost-effectiveness ratio (ICER) | 2,550 €/QALY |
The location of the ICER on the cost-effectiveness plane is shown in the chart below, compared against a Willingness-To-Pay (WTP) threshold of 15,000 €/QALY, which is the lowest one proposed by MAFEIP and the one usually applied for low complexity interventions, such as the considered e‑coaching experiment.
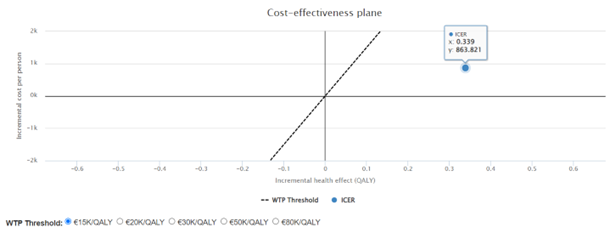
Figure 5. Cost-effectiveness plane for the e‑coaching intervention
We also conducted a sensitivity analysis, with the parameters indicated in the table below, to assess how changes in the proposed annual registration fee would impact on the cost-effectiveness of the intervention and on the related economic viability decision.
Table 6. Parameters for the MAFEIP sensitivity analysis
| Base case | 68.85 €/year |
| Lower end of parameter range | 0 €/year |
| Upper end of parameter range | 400 €/year |
The corresponding cost-effectiveness plane chart is shown below.
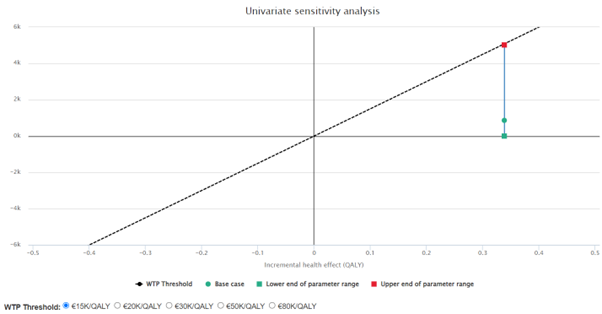
Figure 6. Cost-effectiveness plane chart for the sensitivity analysis
Ultimately, the MAFEIP analysis allows to derive the following two important results:
- With a 68.85€/year fee, which is proposed to ensure economic sustainability, the e‑coaching intervention is highly cost-effective, with an ICER of 2,550€/QALY, which is largely below even the lowest MAFEIP-proposed WTP threshold of 15,000€/QALY, usually applied for low complexity interventions, such as the present e‑coaching experiment
- A sensitivity analysis shows that even fees as high as 400€/year would still guarantee an ICER below the 15,000€/QALY WTP threshold, allowing the decision on the fee to be driven mostly by market considerations (i.e. market acceptability), rather than cost-covering considerations.
 This work has been conducted as part of the GATEKEEPER project. The GATEKEEPER project has received funding from the European Union’s Horizon 2020 research and innovation programme under grant agreement No 857223